Your Genesys Blog Subscription has been confirmed!
Please add genesys@email.genesys.com to your safe sender list to ensure you receive the weekly blog notifications.
Subscribe to our free newsletter and get blog updates in your inbox
Don't Show This Again.

As a key aspect of artificial intelligence (AI), Natural Language Understanding (NLU) bridges the gap between how people speak and what computers understand.
Bots that understand natural language have made serious inroads into customer experience strategies for enterprises. The first thing a bot needs to understand is customer intent. If the bot gets the intent right, it goes its merry way to help the customer self-serve for the issue. However, at times, the NLU system isn’t very confident of the intent it detects. That’s when the user is asked to confirm what the bot detected as an intent — or to restate their intent.
Let’s look at the use of confidence thresholds and the pitfalls of using them without a proper understanding of their effects on the efficacy of the bot.
When an NLU model returns a hypothesis for the intent of an utterance, it comes with a confidence score. Let’s dig into what this score means.
When a conversational AI system attaches a “confidence” value to its answer, the term is being used in its everyday sense. It’s simply a measure of how confident the system is in this hypothesis. The value might look like a probability value, but the sum of the confidence values for a set of hypotheses likely isn’t 1.
Don’t confuse the term “confidence score” with “confidence,” as it’s used in statistics when describing the observed results of a series of tests. In statistics, a 95% confidence interval is the range in which 95% of the output values fall. But our meaning of confidence is different.
A confidence score might also be confused with the “probability” that a hypothesis is correct, because most NLU engines output confidence values between 0.0 and 1.0. But it’s not probability either.
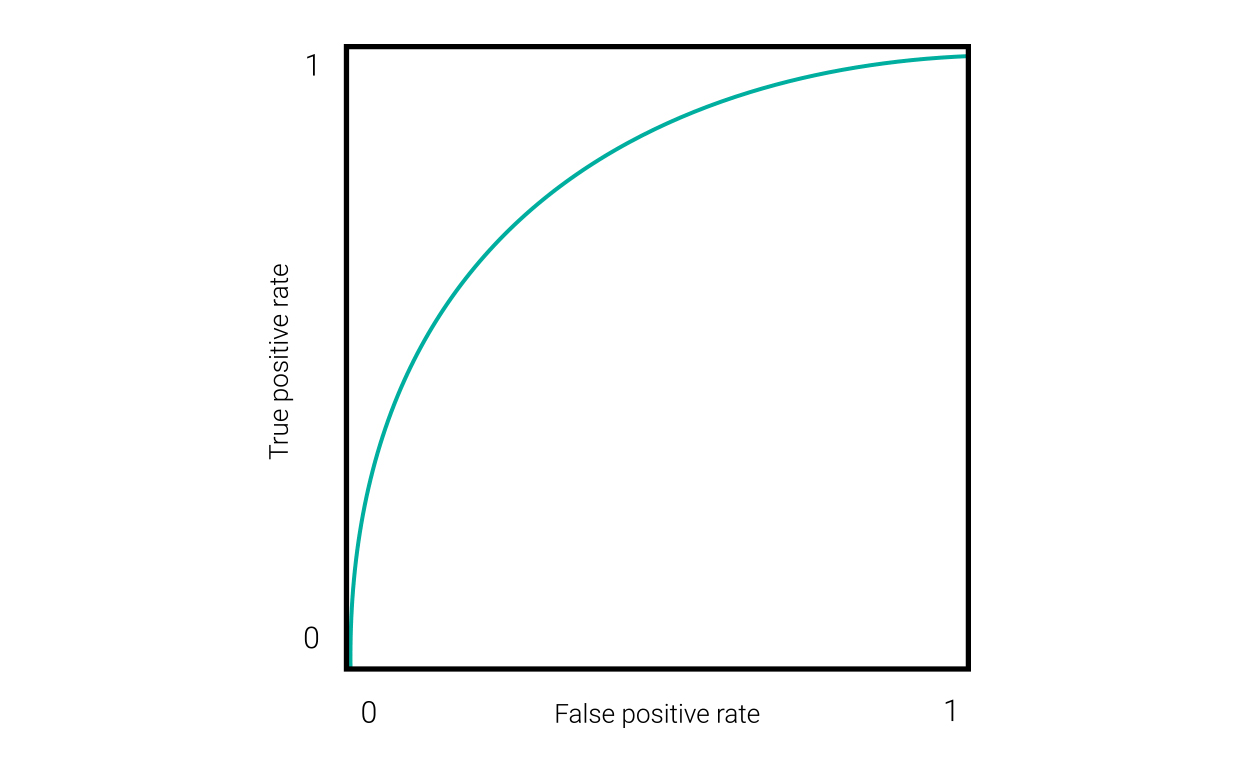
A good way to characterize the performance of an AI system is to look at how it performs at various confidence thresholds. Setting a confidence threshold at 0 means it would allow every hypothesis, correct or incorrect, regardless of its confidence score. Setting it at 1 means it would reject every hypothesis (unless the engine sometimes returns a confidence score of 1). An ideal confidence threshold would remove as many incorrect hypotheses as possible, without removing very many correct hypotheses. One method for finding that point is to draw a Receiver Operating Characteristic (ROC) curve that graphs true positives against false positives at various confidence thresholds, as shown in this figure.

In the lower left corner of this chart, with 0 true and 0 false positives, shows the highest confidence threshold. The upper right shows the lowest threshold. The optimal point where true positives are maximised, and false positives are minimised, lies between them.
ROC curves, like the one above, are useful for binary classifier systems. But an NLU engine that predicts the intent of an utterance is a multi-class system. And, to further complicate things, the system should be evaluated by how well it handles out-of-domain input, or “true negatives.” To get that information, we need to view results differently so they’re tailored to the specific type of confidence threshold we want to use.
An NLU engine can make use of two types of confidence thresholds when reporting hypotheses:
Confirmation threshold: If the confidence score of the top intent hypothesis is below this level, the bot will ask the user to confirm the hypothesis is correct.
Rejection threshold: If the confidence score is below this level, the bot will ask the user to rephrase the input.
A third use for confidence scores would be to detect when the top hypothesis is barely higher than the one in 2nd place, in which case the bot might prompt the user to select between them.
The best way to find a good threshold for a bot is to feed it a set of test data that has been annotated with ground truth values. Then you should inspect the output with the confidence threshold set at different levels. Because confirmation thresholds and rejection thresholds have different purposes, you’ll need to evaluate them separately.
These four categories of hypotheses are relevant for a confirmation threshold:
Note: Of these groups of hypotheses, 1 is the best case; 3 is the worst; 2 and 4 are between them. This is because it might be annoying for the user to have to constantly answer confirmation prompts, but that’s still preferable to accepting an incorrect answer.
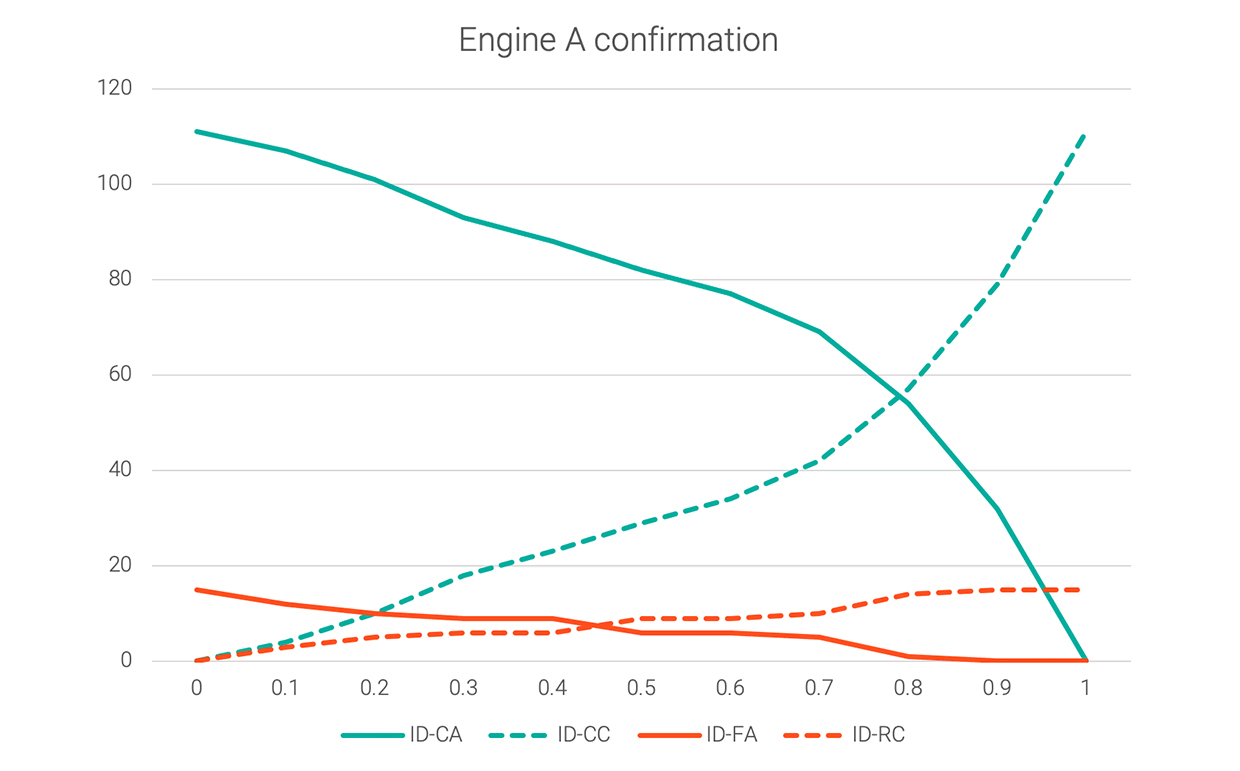
The following graph shows those four values for a sample dataset at each increment of 0.1 between 0 and 1.0 confidence.

The graph shows that, if the confirmation threshold is set to 0, correct-accepts (best) and false-accepts (worst) will both be maximized. If the confirmation threshold is raised to 0.8, there will be almost no errors (false-accepts), but the user will be required to answer confirmation prompts more than half the time.
The ideal setting for this threshold might be around 0.25, where ID-FA has decreased significantly but ID-CA hasn’t dropped too much yet. Ultimately, the decision could be application-specific: How bad false-accepts are, weighed against how bad it is to make the user answer an extra question.
These are the categories of hypotheses that are relevant for deciding on a threshold if every hypothesis below the threshold is rejected:
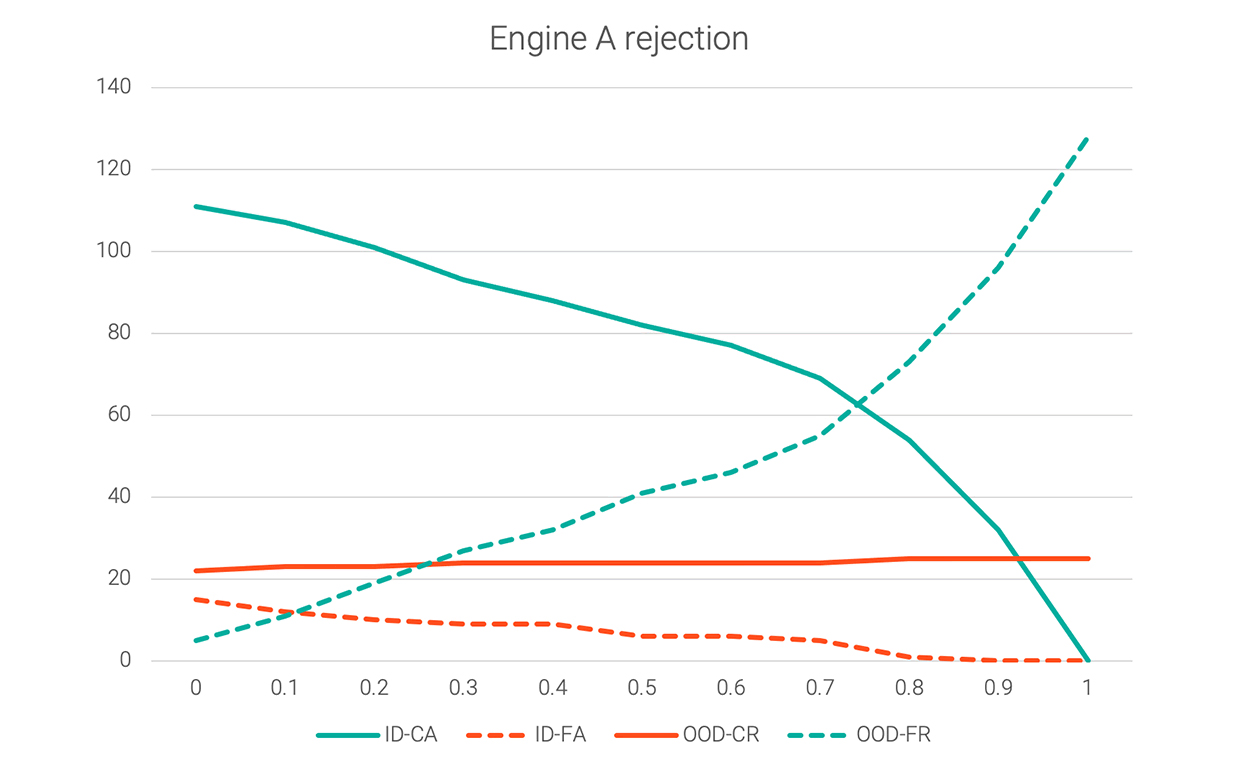
Of these groups of hypotheses, 1 and 3 are correct; 2 and 4 are incorrect. The following graph shows those four values for the same dataset.

If the rejection threshold is set to 0, both correct-accepts and false-accepts will be maximized, while correct and false rejects will be minimised. Increasing the rejection threshold to 0.1 or 0.2 would reduce the false-accepts before the correct-accepts drop off more steeply.
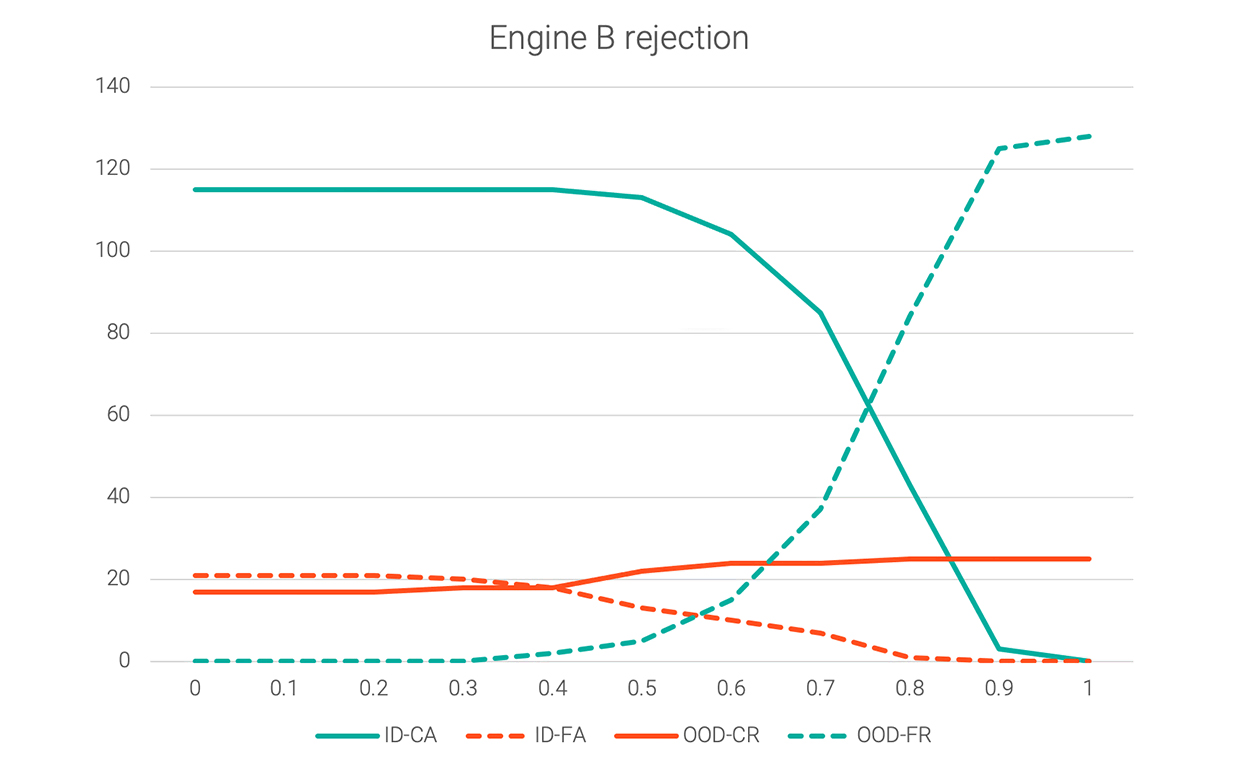
Conversational AI engines vary in how they compute confidence scores. Some, like Engine A, tend to produce hypotheses with confidence values distributed fairly evenly between 0 and 1. For others, the confidence scores are mostly clustered within a certain range — and that changes the shape of their threshold graphs. The following graph shows the rejection threshold for a different engine.

Using the rejection threshold from Engine A (0.2) would clearly not work for Engine B, since Engine B has false positives (ID-FA) that are still quite high at that point. In this case, 0.6 would be a reasonable rejection threshold, allowing ID-FA to fall without sacrificing too much ID-CA. The following shows the same charts overlaid for easier comparison.
Changes to a conversational AI engine might affect the way its confidence scores are distributed across test cases. Be aware of that possibility and re-run this type of threshold test to determine whether you need to adjust the confidence thresholds.
Some bot frameworks are built to work with multiple NLU engines, which could make it look deceptively easy to switch engines. Before switching engines, test your confidence thresholds.
To get the best performance possible, we recommend testing confidence thresholds after creating a new bot — even if you don’t change NLU engines. Different bots using the same engine might have different optimal thresholds.
Read “A practical guide to mastering bots” to learn more best practices for building bots and ensuring your bot blows don’t lead customers to dead ends.
Subscribe to our free newsletter and get the Genesys blog updates in your inbox.
Related capabilities: